In the Deep Dive into SIA series of articles I write in-depth analysis of the Smart Investing Approach (SIA). So far we have covered the following issues:
Why should excess debt be avoided in picking stocks – Deep Dive into SIA (1)
Are higher dividends better than higher growth? – Deep dive into SIA (2)
Scoring – Deep Dive into SIA (3).
Today I wanted to write about how the SIA-style portfolios (Pension Portfolio (PP) and Global Leaders Portfolio (GLP)) grab exposure to the anchors of the SIA philosophy of investing. Namely Long-Term High-Grade Sovereign Bonds, which alongside Gold bullion are the safe haven assets I use to balance the equity allocation of the portfolios accordingly to the phase of the economic cycle.
The choice of portfolio anchors
The choice of Long-Term High-Grade Sovereign Bonds (represented by TLT US ETF) and Gold (represented by GLD US ETF) as anchors of the portfolio have the following reasoning (those of you that read the PP and GLP Inception posts already know that):
(a) They have zero or negative correlation to equities, hence they give the portfolios the necessary asset class diversification effects. I present it in the below table. The table has a time span of 18 years, because no longer history is available for TLT. But it does support the general common knowledge that bonds have a negative correlation with equities and Gold has zero or close to zero correlation with equities:

As you can see TLT and IDCOT2 (the underlying index of TLT) have a -0,32-0,34 correlation coefficient with the four major US equity indices (DowJones [INDU], S&P500 [SPX], Nasdaq Composite [CCMP], Nasdaq100 [NDX]). And the second anchor, Gold (represented by XAU – Gold spot price – to ensure longer history than GLD), has close to zero correlation coefficient with the respecitve indices. GLD and XAU have perfect correlation of 1. Moreover, TLT and XAU are positively correlated with each other with a coefficient of 0,21. This is also desirable, because in case of an economic downturn the SIA portfolios are by rule mostly allocated in long-term bonds and Gold (plus some cash buffer of course).
(b) Long-Term High-Grade Sovereign Bonds and Gold bullion are treated as safe havens. Owning a US long-term debt in times of equity markets turmoils (1st of all during contraction/recession) is the usual way investors look to stay invested and not just turn their assets to cash. Given the fact that SIA portfolios are usually already prepositioned in the anchors (TLT, GLD) when the troubles come (thanks to the forecasting model (EAS) and appropriate asset reallocation before cycle peak), it makes them enjoy the returns the other market participants only chase.
(c) Additionally GLD is a good inflation hedge.
Why TLT and not direct purchase of bonds
Many people say these days that ETFs are a nightmare and that they are killing the very clue of markets. There are of course reasons for that. They often lead to mispricing of certain assets, they artificially prolong trends and cause corrections to be way faster and deeper than they should be or were in the past. They generally increase what is called “horde thinking”. But, and there’s always a but, there are certain characteristics of ETFs that have caused their tremendous rise over the last decade and make them appealing especially to smaller non-institutional investors. These are mainly: they are cheap vs. active funds, they allow small investors to grab exposure on some assets normally not accessible for them, they replicate their benchmark as a rule without trying to beat it, which often ends bad in case of actively managed products.
For these reasons it is much easier to grab exposure on US (or any other High-Grade) sovereign debt via an ETF, rather than directly. An investor who does not have time and capabilites or knowledge on how to manage bond investments will often be better off just buying an index of bonds via an ETF. He will not grab extraordinary gains, but at least he will get the average returns that sovereign bonds can give without worrying of things like high par value of some bonds, reinvesting coupons, etc..
All the above holds true under some assumptions of course:
(a) the issuer of an ETF must be trustworthy,
(b) ETF should be liquid to avoid mispricing from the underlying and this usually goes along with the fund’s size (Assets Under Management),
(c) ETF should replicate the appropriate underlying the investor is looking for,
(d) ETF should be based on a real underlying instrument (some ETFs are based on derivatives or swaps, which increases their risk),
(e) ETF should be cheap.
TLT fulfills all the above criteria. Let me shortly elaborate on this. Below is a Bloomberg screenshot with the biggest US ETFs giving exposure to Long-Term Debt:
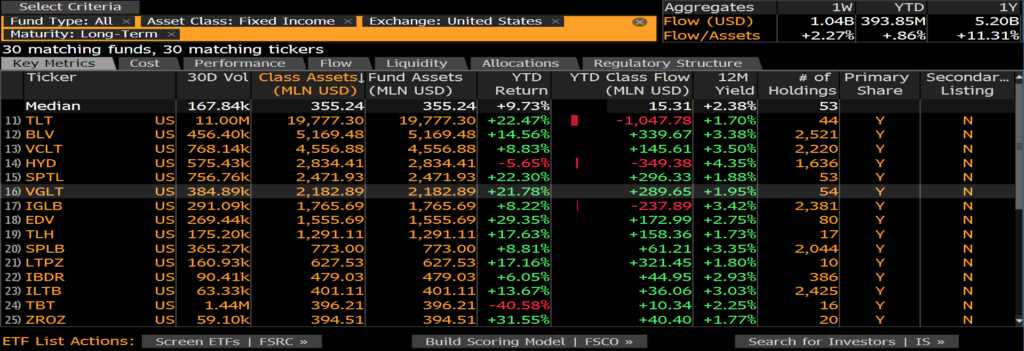
As you can see TLT has by far the biggest Assets (almost $20bn). Moreover the issuer of TLT is iShares owned by BlackRock, the world’s biggest asset management company with over $7,4tn AUM as of end 2019. The second biggest US long-term debt ETF is BLV issued by Vanguard, but it also includes investment grade corporate debt. It’s a quarter of TLT’s size.
You can also see that it is very liquid and that the Bid/Ask spread for TLT is very low (0,01):

Moreover TLT has the highest rating, invests 100% in treasuries (unlike some other ETFs)
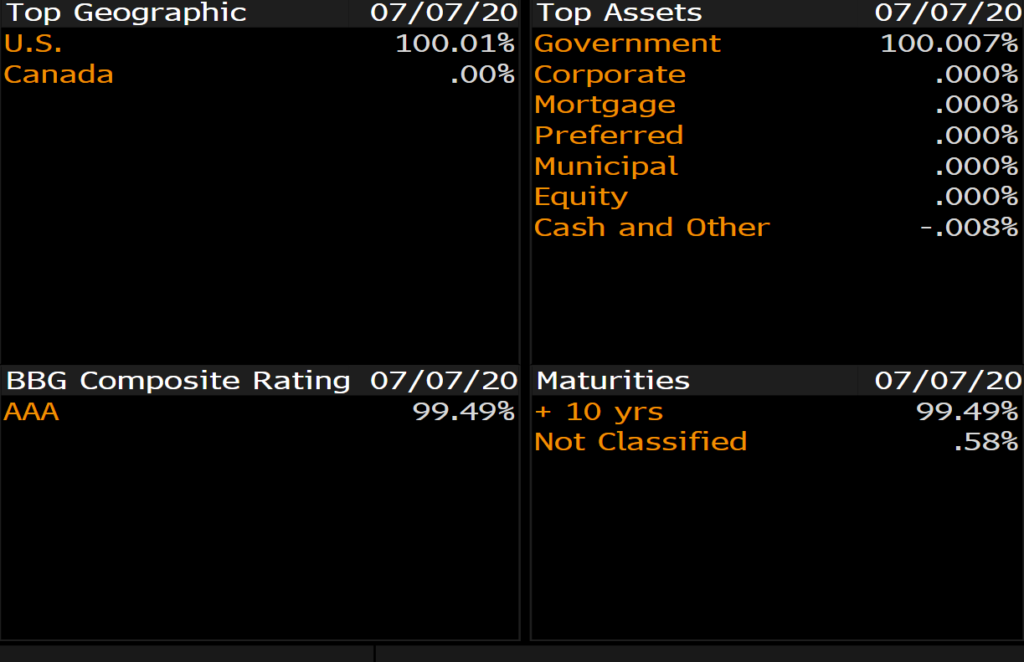
With 15bps (0,0015%) management fee TLT is not necessarily the cheapest ETF, but still cheap (BLV for instance has a 5bps fee and SPTL has 6bps, but both are smaller and SPTL has a wideer Bid/Ask spread).
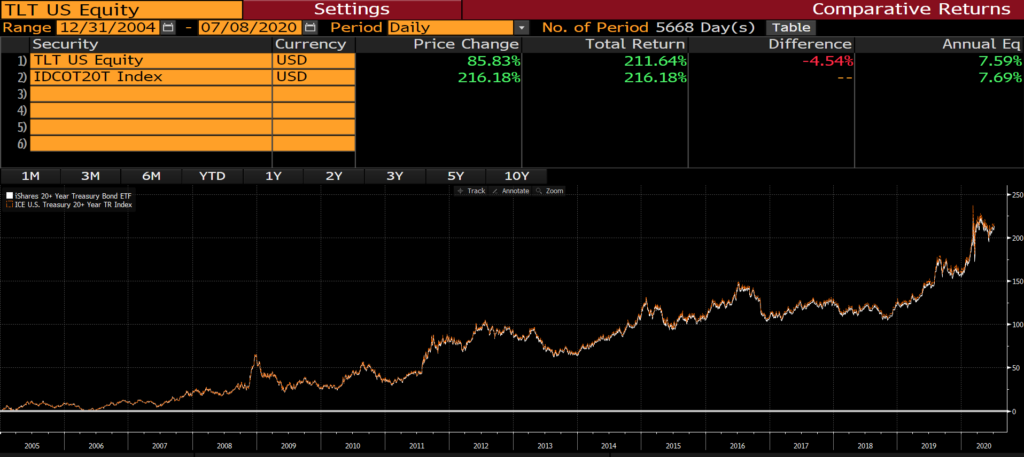
It replicates its underlying index (IDCOT20T) with high accuracy. IDCOT20T is the ICE U.S. Treasury 20+ Years Bond Index that is part of a series of indices intended to assess U.S. Treasury issued debt. Only U.S. dollar denominated, fixed rate securities with minimum term to maturity greater than twenty years are included. Over the years TLT has done very well vs. its benchmark as per below screenshot (10bps annual average miss = less than management fee):
TLT also fulfills the requirement of not being based on derivatives or swaps, which we want to aviod:

Gold via GLD
Let’s move on to analysing the other anchor of the SIA-style portfolios – Gold (XAU), to which we get exposure via GLD. Below is the list of the biggest commodities ETFs available:
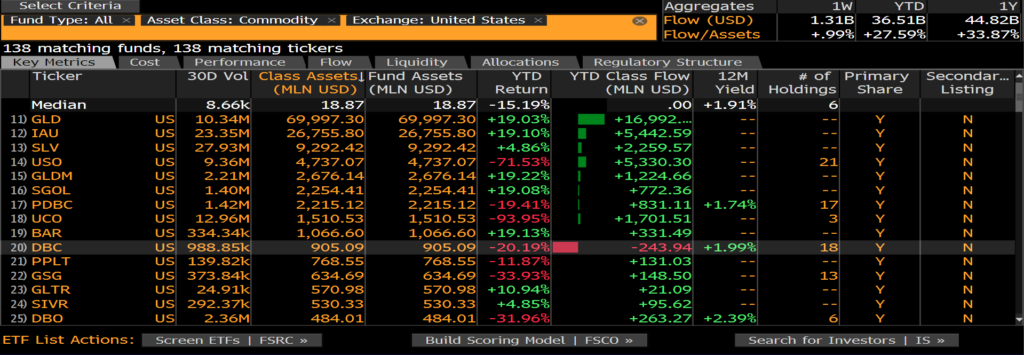
As you can see GLD is by far the biggest ETF investing in commodities ($70bn AUM). The other ones investing in Gold form the above list are: GLDM (issued by SPRD of State Street), SGOL (issued by Aberdeen), BAR (issued by GraniteShares). GLD itself is issued by SPDR (State Street) – one of the biggest US financial institutions based in Boston ($2,5tn AUM as of end 2018). Other ETFs you see above are based on other commodities like oil, silver, platinium, etc. or commodity indices.
Here are the trading charcteristics of GLD:

GLDM, the younger brother of GLD, was only created in 2018. Even though it is cheaper than GLD (18bps fee vs. 40bps fee) and its Bid/Ask spread is only 0,01 vs. 0,04 for GLD, its assets are only $2,7bn for now. Its single share is less than a 5th of GLD now, so it might also be more accesssible for small retail investors. GLDM might once be a competitor for GLD, but for now we’re sticking to GLD.
GLD is not leveraged and is covered with physical Gold bullion – this is very important:

And last, but not least, here’s the GLD’s performance vs. its benchmark (GOLDLNPM Index – the ICE benchmark for Gold spot price):
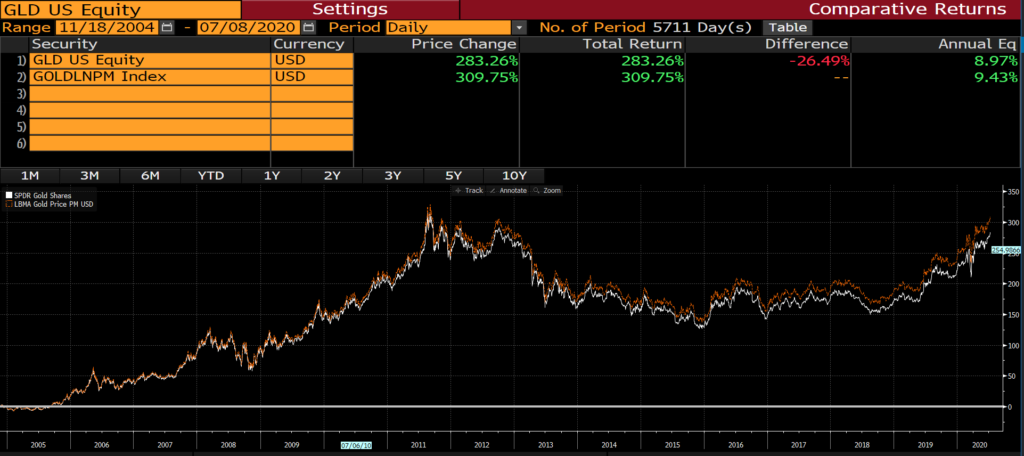
GLD misses the Gold bullion spot price by approximately 40bps/yr, which is basically its expense ratio. Acceptable.
Conclusions
Both TLT and GLD fulfill easily the requirements of being the SIA portfolios easy-accessible anchors. They provide safety, liquidity, acceptable costs. Both ETFs will be watched closely in the future and may be subject to change in both PP and GLP.
Thanks and happy investing all!
yours,
PC
Disclaimers: None of the ideas, views and thoughts presented here shall ever be taken as a recommendation to buy or sell stocks,bonds,FX,commodities or any other financial instruments as stated in REGULATION (EU) No 596/2014 OF THE EUROPEAN PARLIAMENT AND OF THE COUNCIL of 16 April 2014 on market abuse (market abuse regulation) and repealing Directive 2003/6/EC of the European Parliament and of the Council and Commission Directives 2003/124/EC, 2003/125/EC and 2004/72/EC or the Regulation of the Polish Minister of Finance of 19 October 2005 on information constituting recommendations regarding financial instruments, their issuers or exhibitors (Journal of Laws of 2005, No. 206, item 1715) or the Polish Act of 10 February 2017 amending the act on trading in financial instruments and some other acts. The article is for educational reasons and purely presents private views of the author, thus the author shall not be claimed eligibile for any losses of a third party resulting from trading activities based upon this article. The author uses his best knowledge and data from sources believed to be reliable, but makes no representations as to the accuracy of the data.Full Disclaimers&Liability Limitations page.

